These ratings were created by Sir Puntalot back in 1997 and the formula has never changed since then. They were designed to find a way of seeing at a glance, what the true performance of teams were in a match, and not just be guided by the scoreline. You could read tens of match reports, but spending hours doing that every week is not my idea of fun! Hence, the ratings were born.
Scroll down to find out how they work and what the difference between the “Performance Ratings” and “Prediction Ratings” are, but they are very much one and the same thing. Explanation and examples below, and there’s plenty of discussion of the ratings on our world famous forum.
ELO Performance Ratings
The ELO performance ratings were where it all started and they were designed to always give a true reflection of a match, and rather than babble on, we’ll show examples below. Performance ratings are produced AFTER the match has been played.


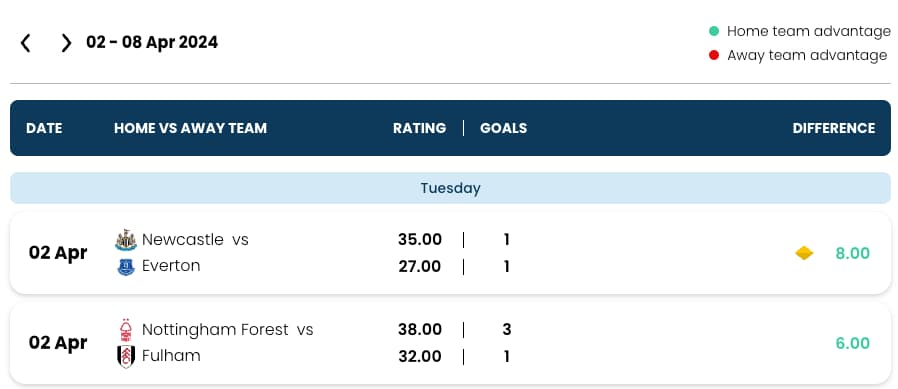
So, the example above shows a match from the Premier League. First of all take note of all the matches that have a diamond next to them, these are highlighted to show you at a glance where the result didn’t necessarily match performance.
So, in the example above, Newcastle clearly outplayed Everton to quite a big degree and having watched this match, the ratings were spot on. Newcastle on all the stats deserved to win, but they didn’t.
Let’s take a more extreme example now.


Above, you can clearly see that Brighton clearly outplayed Brentford. They had a much higher ratings, but just couldn’t put the ball in the back of the net. And this is why we created the ELO Ratings.
We created the ELO Ratings so that you can see how each team has performed at a glance – irrespective of the result.


